About Javier Aparicio

Profesor de la División de Estudios Políticos del CIDE, en México. (Assistant professor in the Political Studies Division at CIDE).

Votos nulos en 2003 y 2006

En las elecciones intermedias de 2003 hubo 896,649 votos nulos (3.3% del total). En 2006 hubo 1,033,665 votos nulos para diputados de mayoría relativa (2.46% del total). Antes de que el movimiento “anula tu voto” se cuelgue la medalla de conseguir más de 1 millón de votos nulos, vale la pena analizar qué estados registraron un mayor porcentaje de votos nulos en 2003 y 2006, respectivamente.

Aquí están las gráficas, ordenadas de mayor a menor tasa de voto nulo.

Porcentaje de votos nulos por estado, 2006.

Porcentaje de votos nulos por estado, 2003.

Votar donde duele

Mucho se ha hablado del voto nulo como herramienta de castigo “a los partidos”. Más allá del valor expresivo (feel good value) de tomarse la molestia de ir a votar… por nadie, vale la pena comentar sobre los efectos observables del voto nulo en México.

El voto nulo cuenta para la tasa de participación (turnout) y para calcular la tasa de votación necesaria para que un partido mantenga su registro de un partido nacional (en México, 2%), pero no cuenta para determinar la asignación de curules por representación proporcional (RP). Esto implica que los votos nulos producen efectos encontrados en la probabilidad de supervivencia de un partido pequeño, por un lado, y en el tamaño de su bancada, si acaso mantiene el registro, por otro.

Veamos un ejemplo con peras y manzanas para ilustrar estos efectos. Consideremos un caso extremo. Si hubiera 10 millones de votos, y 2 millones de votos nulos (20%, una señal fuerte como pocas), cada partido debería conseguir al menos 200 mil votos para mantenerse con vida. Por lo tanto, mientras mayor sea el número de votos nulos, más difícil será librar el umbral mínimo del 2% para cada partido–llamemos a esto efecto umbral.

Sin embargo, una vez superado este umbral, los votos nulos (y los de candidatos no registrados) se restan de la votación total para poder asignar las curules RP entre los partidos “con registro” (como es obvio, los votos nulos no pueden conseguir curules).

Siguiendo con el ejemplo extremo, ¿cuántas curules conseguiría un partido pequeño X–de esos que tanto decepcionan a muchos– de haber conseguido 300 mil votos (y con ello más del 2% requerido para sobrevivir)?

Restemos 2 millones de nulos y asumamos que cero votos para candidatos “no registrados”. Ahora el voto total válido es de 8 millones, y al partido X le corresponderían 3.75% de curules RP, algo así como 7 u 8 curules. Pero, de no haber habido 8 sino 10 millondes de votos válidos (asumamos que ninguno de estos nulos se inclinaría por X), el partido X sólo hubiera recibido 3% de votos y 6 curules RP. Llamemos a esto efecto RP.

Las cifras de este ejemplo son algo exageradas pero el punto central se mantiene: a mayor número de votos nulos, más votos serán necesarios para que cualquier partido sobreviva (a mayor número de nulos, mayor efecto umbral). Sin embargo, aquellos partidos chicos que superen el umbral de 2% de la votación total, acabarán recibiendo más curules RP con relación a las que obtendrían sin los votos nulos (a mayor número de nulos, mayor efecto RP).

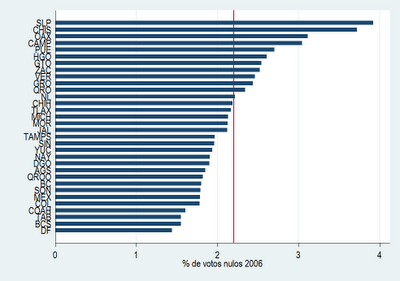
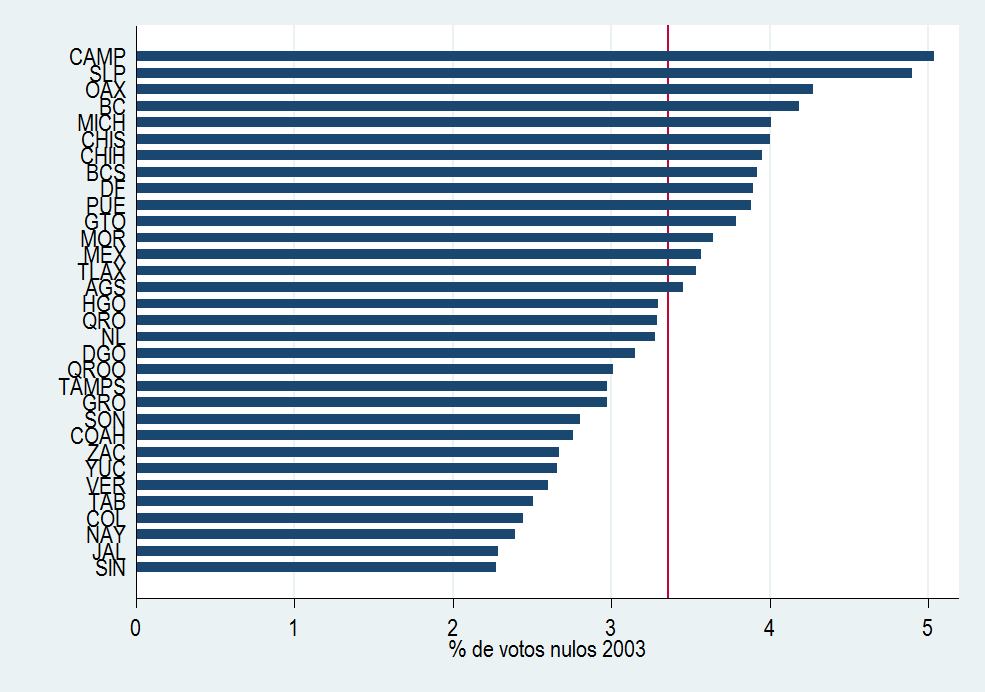
El efecto umbral hace la vida difícil a los partidos pequeños. Pero el efecto RP les da más curules a los partidos que sobreviven. Para niveles de voto nulo más realistas, digamos de entre 2 o 3% de la votación total –como los que hemos observado en elecciones pasadas– el efecto umbral y el efecto RP son muy pequeños y practicamente se cancelan mutuamente. Por eso algunos insistimos con necedad instrumental: ¿de qué sirve anular el voto si, aunque te haga sentir como un gran ciudadano castigador en realidad no lastima a (casi) nadie? Mejor hay que votar donde duele.

Opposing Chavez

The Price of Political Opposition: Evidence from Venezuela’s Maisanta

http://papers.nber.org/papers/W14923

Chang-Tai Hsieh, Edward Miguel, Daniel Ortega, Francisco Rodriguez

In 2004, the Chavez regime in Venezuela distributed the list of several million voters whom had attempted to remove him from office throughout the government bureaucracy, allegedly to identify and punish these voters. We match the list of petition signers distributed by the government to household survey respondents to measure the economic effects of being identified as a Chavez political opponent.

We find that voters who were identified as Chavez opponents experienced a 5 percent drop in earnings and a 1.5 percentage point drop in employment rates after the voter list was released. A back-of-the-envelope calculation suggests that the loss aggregate TFP from the misallocation of workers across jobs was substantial, on the order of 3 percent of GDP.

Electoral Accountability and Corruption

This is very replicable research… that is, if we only had reelection… and good data on corruption.

Electoral Accountability and Corruption: Evidence from the Audits of Local Governments

April 2009
Claudio Ferraz and Frederico Finan
http://www.nber.org/papers/w14937

Political institutions can affect corruption. We use audit reports from an anti-corruption program in Brazil to construct new measures of political corruption in local governments and test whether electoral accountability affects the corruption practices of incumbent politicians. We find significantly less corruption in municipalities where mayors can get reelected. Mayors with re-election incentives misappropriate 27 percent fewer resources than mayors without re-election incentives. These effects are more pronounced among municipalities with less access to information and where the likelihood of judicial punishment is lower. Overall our findings suggest that electoral rules that enhance political accountability play a crucial role in constraining politician’s corrupt behavior.

Elecciones intermedias México 2009

El Universal del día de hoy, Lunes 11 de mayo de 2009, me publicó un breve artículo sobre las preferencias electorales al inicio de la campaña.

“Apenas comenzaron las campañas oficiales rumbo a la elección de diputados federales y ya es común preguntarnos cómo afectará la influenza el resultado del 5 de julio próximo y, sobre todo, si ésta beneficiará o perjudicará al PAN. Antes de especular vale la pena repasar lo que ha ocurrido en elecciones intermedias recientes. En 1997 el PRI perdió 61 curules; y en 2003 el PAN perdió 59 asientos de los 207 con que contaba. Sucede que es común observar que en elecciones intermedias el partido del Presidente pierde fuerza en el Poder Legislativo por muy diversas razones: por un lado los efectos de arrastre de los candidatos presidenciales están ausentes y, por otro lado, se dice que el electorado hace una especie de referéndum sobre la gestión de un presidente que se desgasta más que sus opositores…”

Pueden leer el resto aquí.

Una columna previa sobre popularidad presidencial, publicada el jueves 2 de abril de 2009, está aquí.

Swine flu, measurement error, and policy responses

Is the Mexican government overreacting to the swine flu virus outbreak? It is still to soon to know. So far, in the first week of the “contingency”, most of the actions taken by the Mexican government have been backed by the WHO, and by a majority of the public opinion.

We also have witnessed a parade of numbers trying to assess the evolution and riskiness of the virus. How can we measure this? An important statistict in epidemiology is the Case Fatality Ratio (CFR = number of deaths / number of cases). The latest figure of “suspected” swine flu-deaths is 159 but only 7 of them have been confirmed as positive cases by laboratory tests. Also, the latest estimate of atypical neumonia cases in this period is about 2500 (April 29th, 2009). Thus, making the extreme assumption that all deaths become positive cases (and keeping all else equal) results in an estimated (upper bound) CFR of 159/2500 = 6.36%. Clearly, these figures will change as more positive cases and/or swine-related deaths occur (see update below).

It is important to note that measurement error on either the numerator or the denominator affect any CFR estimate, thereby making the virus to appear more or less deadly. For instance, if the virus is very contagious but not deadly, the CFR will become approximately close to zero (not too risky a ratio, but consider that seasonal influenza kills 36,000 people in the US every year). On the other hand, if the virus turns more deadly but not very contagious, the CFR will increase (for instance, SARS has a CFR of about 50%, very deadly indeed).

But then again, is the Mexican government overreacting? Do we really need to close schools and restaurants, or should we focus instead on revamping our health services? We don’t know yet. Oddly enough, the more deadly this virus becomes (ie, the higher the CFR worldwide), the better our government will look in retrospective for properly reacting to a serious risk.

Alas, if the swine flu virus ends up being more deadly here than elsewhere (ie, with a CFR higher in Mexico than abroad), the worse our overall health system will look and the more off-target the Mexican reaction will be. It may be the case that Mexico’s poor health care services and limited coverage turn more deadly than a new found virus. I truly hope to be wrong on this.

Related links:

Swine Flu and the Mexico Mystery: Why does the swine flu seem to be more deadly in Mexico? from Slate
Mexico’s High Death Rate Poses Key Question on Virus from the Wall Street Journal
Swine flu: what do CFR, virulence and mortality rate mean? from Effect measure
Swine flu: Questions and answers from the Virology blog
Disease Outbreak News from the World Health Organization.

May 6 Update:
In Mexico: 29 deaths / 942 confirmed cases = 3.07% CFR
In the US: 2 deaths / 642 confirmed cases = 0.311 CFR

Risk Communication in Epidemics

Great piece on the the hazard vs. public outrage tradeoff.

"Let me tell you the basics of risk communication, and then I want to apply them, a little bit, to bird flu. The fundamental principle of risk communication can be summarized in a number, [which] is the correlation between how much harm a risk does and how upset people get about it. If you look at a long list of risks, and you rank them in order of how upset people get [about them], then you rank them again in order of how much harm they do, then you correlate the two, you get a glorious 0.2.
Those of you who remember your statistics know you can square a correlation coefficient to get the percentage of variance accounted for: If you square 0.2, you get 0.04, or 4% of the variance.
That is, the risks that kill people and the risks that upset people are completely different. If you know that a risk kills people, you have no idea whether it upsets them or not. If you know it upsets them, you have no idea whether it kills them or not."

Read the whole thing by Peter Sandman, Risk Communication Specialist

Comparative trends in US presidential elections 2000 to 2008

In the final days before the election, pundits and the media will claim that the race “is tightening” and that “you never know what may happen”. To be sure, there is never a 100% certainty, yet I believe the financial crisis pretty much settled the 2008 election (I’ll let you decide to what extent the crisis was a surprise event). Any supporting evidence? This is what Charles Franklin (Univ of Wisconsin, Madison) wrote on Oct 6th, 2008, almost a month before election day:

“The 2008 campaign had not seen a really big move in preferences until the financial crisis hit three weeks ago today. Since that time, the Obama-McCain margin has shifted almost 9 points in Obama’s favor, converting a small McCain lead into a substantial Obama advantage. This swing reversed the gains McCain made with the Republican convention and the week after during which he picked up about 4 points and took the lead for the first time since March.
I wrote earlier that we had not seen a move in 2008 as large as ones we saw in both 2000 and 2004. That is no longer true of 2004, though the current run is not yet as large as the one Gore mounted in 2000.
The Bush counter-assault in 2000, after Gore’s surge, was almost eight points, and began at almost the same point in the campaign, about 57 days out. Voters are making up their minds at about the same rate as they did in 2000. If this year follows that pattern, look for some serious decision making over the next two weeks.

These are Franklin’s critical graphs:

Sam Wang (Princeton Election Consortium) links to the (even clearer) electoral vote predictions for 2004 here, and for 2008 here. He also commented that:

In 2004, candidate game-shifting events were:

7/26: Democratic convention
8/5-31: Swift Boat Veterans for Truth ad campaign
8/30: Republican convention
9/30: Debate #1
The other debates (10/8, 10/13) had no measurable effect.
In 2008, the game-shifting events have been:

6/7: Hillary Clinton concedes
8/1: McCain’s “Celebrity” ad campaign
8/25-9/5: Both conventions and McCain announcement of Palin
9/11-12: Palin on ABC News w/Charlie Gibson, McCain on “The View”
9/26: Obama-McCain debate #1
All of these events were shortly followed by swings.

Public funding and the 2008 election

This is George F. Will, in today's Washington Post, on some of the campaign finance lessons from the 2008 presidential election:
 
Call him John the careless
Thursday, October 30, 2008
 
(…) McCain revived a familiar villain — "huge amounts" of political money — when Barack Obama announced that he had received contributions of $150 million in September. "The dam is broken," said McCain, whose constitutional carelessness involves wanting to multiply impediments to people who want to participate in politics by contributing to candidates — people such as the 632,000 first-time givers to Obama in September.

Why is it virtuous to erect a dam of laws to impede the flow of contributions by which citizens exercise their First Amendment right to political expression? "We're now going to see," McCain warned, "huge amounts of money coming into political campaigns, and we know history tells us that always leads to scandal." The supposedly inevitable scandal, which supposedly justifies preemptive government restrictions on Americans' freedom to fund the dissemination of political ideas they favor, presumably is that Obama will be pressured to give favors to his September givers. The contributions by the new givers that month averaged $86.

One excellent result of this election cycle is that public financing of presidential campaigns now seems sillier than ever. The public has always disliked it: Voluntary and cost-free participation, using the check-off on the income tax form, peaked at 28.7 percent in 1980 and has sagged to 9.2 percent. The Post, which is melancholy about the system's parlous condition, says there were three reasons for creating public financing: to free candidates from the demands of fundraising, to level the playing field and "to limit the amount of money pouring into presidential campaigns." The first reason is decreasingly persuasive because fundraising is increasingly easy because of new technologies such as the Internet. The second reason is, the Supreme Court says, constitutionally impermissible. Government may not mandate equality of resources among political competitors who earn different levels of voluntary support. As for the third reason — "huge amounts" (McCain) of money "pouring into" (The Post) presidential politics — well:

The Center for Responsive Politics calculates that, by Election Day, $2.4 billion will have been spent on presidential campaigns in the two-year election cycle that began in January 2007, and an additional $2.9 billion will have been spent on 435 House and 35 Senate contests. This $5.3 billion is a billion less than Americans will spend this year on potato chips.

Migration policy, Media bias, Direct democracy (new papers)

Do Interest Groups Affect U.S. Immigration Policy?
Date: 2008-10-11
By: Prachi Mishra, Anna Maria Mayda, Giovanni Facchini
 
While anecdotal evidence suggests that interest groups play a key role in shaping immigration policy, there is no systematic empirical analysis of this issue. In this paper, we construct an industry-level dataset for the United States, by combining information on the number of temporary work visas with data on lobbying activity associated with immigration. We find robust evidence that both pro- and anti-immigration interest groups play a statistically significant and economically relevant role in shaping migration across sectors. Barriers to migration are lower in sectors in which business interest groups incur larger lobby expenditures and higher in sectors where labor unions are more important.
 
Media Bias and Influence: Evidence from Newspaper Endorsements
Date:2008-10
By: Brian G. Knight and Chun-Fang Chiang
 
This paper investigates the relationship between media bias and the influence of the media on voting in the context of newspaper endorsements. We first develop a simple econometric model in which voters choose candidates under uncertainty and rely on endorsements from better informed sources. Newspapers are potentially biased in favor of one of the candidates and voters thus rationally account for the credibility of any endorsements. Our primary empirical finding is that endorsements are influential in the sense that voters are more likely to support the recommended candidate after publication of the endorsement. The degree of this influence, however, depends upon the credibility of the endorsement. In this way, endorsements for the Democratic candidate from left-leaning newspapers are less influential than are endorsements from neutral or right-leaning newspapers, and likewise for endorsements for the Republican. These findings suggest that voters do rely on the media for information during campaigns but that the extent of this reliance depends upon the degree and direction of any bias.
 
Does Direct Democracy Reduce the Size of Government? New Evidence from Historical Data, 1890-2000
Date: 2008-10
By: Patricia Funk and Christina Gathmann
 
Using historical data for all Swiss cantons from 1890 to 2000, we estimate the causal effect of direct democracy on government spending. The main innovation in this paper is that we use fixed effects to control for unobserved heterogeneity and instrumental variables to address the potential endogeneity of institutions. We find that the budget referendum and lower costs to launch a voter initiative are effective tools in reducing canton level spending. However, we find no evidence that the budget referendum results in more decentralized government or a larger local government. Our instrumental variable estimates suggest that a mandatory budget referendum reduces the size of canton spending between 13 and 19 percent. A 1 percent lower signature requirement for the initiative reduces canton spending by up to 2 percent.
Keywords: Direct Democracy, Fiscal Policy, Switzerland
 

Myths about the 2008 crisis

Three economists at the Federal Reserve Bank of Minneapolis, Chari, Christiano and Kehoe, point out to Four Myths about the Financial Crisis of 2008 (it's a short paper and full of graphs). 
 
"Clearly, the United States and the world economy are undergoing a major financial crisis. Interbank borrowing and lending rates have risen to unprecedented levels relative to U.S. Treasury Bills. Several major financial institutions have failed. These real problems have also been associated with four widely-held myths about the nature of the financial crisis and the associated spillovers to the rest of the economy. The financial press and policymakers have made four claims about the nature of the crisis:
  1. Bank lending to nonfinancial corporations and individuals has declined sharply.
  2. Interbank lending is essentially nonexistent.
  3. Commercial paper issuance by nonfinancial corporations has declined sharply and rates have risen to unprecedented levels.
  4. Banks play a large role in channeling funds from savers to borrowers.
Here we examine these claims using data from the Federal Reserve Board. At least based on data up until October 8, 2008, we argue that all four claims are false."
 
So yes, it looks like capitalism will survive… On the other hand, a summary of the US real estate market adjustment process  is here.
 

Undecided voters

A funny but perhaps true flowchart from 235.com.

“The race for president between Barack Obama and John McCain has been going on for close to 17 years now, and yet still—still!—there are some voters who haven’t made up their minds about whom to vote for. Who are these undecideds, and what could possibly be going on in their tiny, tiny brains?”

The real estate bubble and the adjustment

A summary from Calculated Risk  (check out the link to see nice graphs).
 
"I'm frequently asked if I'm more concerned today than I was in 2005. There are reasons for concern: the credit markets have seized up, many financial institutions are insolvent, consumer spending and investment in commercial real estate is starting to decline, export growth appears to be slowing, the unemployment rate is rising … and the economy is clearly in a recession. There are huge and scary downside risks today, but I'm actually more sanguine now than I was in 2005. If you think back to 2005, we were standing at the precipice, and there was no where to go but over the cliff.
 
Housing starts have collapsed by more than half since 2005. This decline seemed obvious and inevitable in 2005, and now most of the adjustment has already happened. Which was better for the economy looking forward? To be standing at the edge (in 2005) or to be much nearer the bottom in 2008?

Just like for housing starts, new home sales have collapsed by more than half since 2005. The good news is starts of single family homes built for sale have fallen below new home sales, and new home inventory is declining (although existing home inventory is still near record levels). Once again the bulk of the adjustment is now behind us.

(House price / income ratios are back to 2003 levels.)  Although I believe there are more price declines ahead (and therefore more homeowners with negative equity and more foreclosures), prices are much more reasonable today than in 2005.

The price adjustments were inevitable, and progress is being made."


Throw the bums out

A nice summary on voter irrationality from Larry Bartels:

“While voters are busy meting out myopic, ­simple-­minded rewards and punishments, political observers are often busy exaggerating the policy content of the voters’ verdicts. The prime example in American political history may be the watershed New Deal election of 1936. Having swept into office on a strong tide of economic discontent in 1932, Franklin Roosevelt initiated a series of wide-ranging new policies to cope with the Great Depression. According to the most authoritative political scholar of the era, V. O. Key, “The voters responded with a resounding ratification of the new thrust of governmental policy”—a stunning 46-state landslide that ushered in an era of Democratic electoral ­dominance.24

The 1936 election has become the most celebrated textbook case of ideological realignment in American history. However, a careful look at ­state-­by-­state voting patterns suggests that this resounding ratification of Roosevelt’s policies was strongly concentrated in the states that happened to enjoy robust income growth in the months leading up to the vote. Indeed, the apparent impact of ­short-­term economic conditions was so powerful that, if the recession of 1938 had occurred in 1936, Roosevelt probably would have been a ­one-­term ­president.25

It’s not only in the United States that the ­Depression-­era tendency to “throw the bums out” looks like something less than a rational policy judgment. In the United States, voters replaced Republicans with Democrats in 1932 and the economy improved. In Britain and Australia, voters replaced Labor governments with conservatives and the economy im­proved. In Sweden, voters replaced Conservatives with Liberals, then with Social Democrats, and the economy improved. In the Canadian agricultural province of Saskatchewan, voters replaced Conservatives with Socialists and the economy improved. In the adjacent agricultural province of Alberta, voters replaced a socialist party with a right-leaning party created from scratch by a charismatic radio preacher peddling a flighty ­share-­the-­wealth scheme, and the economy improved. In Weimar Germany, where economic distress was deeper and ­longer ­lasting, voters rejected all of the mainstream parties, the Nazis seized power, and the economy improved. In every case, the party that happened to be in power when the Depression eased went on to dominate politics for a decade or more thereafter. It seems far-fetched to imagine that all these contradictory shifts represented ­well-­considered ideological conversions. A more parsimonious interpretation is that voters ­simply—­and ­simple-­mindedly—­rewarded whoever happened to be in power when things got ­better.

Stupid? No, just human. And ­thus—­to borrow the title of another current ­best­seller, by behavioral economist Dan ­Ariely—­“predictably irrational.” That may be bad ­enough.”

GOTV and likely voters

Via realclearpolitics–This is what the the Washington Post wrote on Sunday:

Sen. Barack Obama’s campaign intends to avoid a (2004) repeat by building an
organization modeled in part on what Karl Rove used to engineer Bush’s victory:
a heavy reliance on local volunteers to pitch to their own neighbors,
micro-targeting techniques to identify persuadable independents and Republicans
using consumer data, and a focus on exurban and rural areas. But in scale and
ambition, the Obama organization goes beyond even what Rove built. The campaign
has used its record-breaking fundraising to open more than 700 offices in more
than a dozen battleground states, pay several thousand organizers and manage
tens of thousands more volunteers.

And this is what Gallup has to say regarding how this get out the vote strategy may affect its survey-weighting methods:

Likely Voter Estimates
“Obama’s current advantage is slightly less when estimating the preferences of likely voters, which Gallup will begin reporting on a regular basis between now and the election. Gallup is providing two likely voter estimates to take into account different turnout scenarios.
The first likely voter model is based on Gallup’s traditional likely voter assumptions,which determine respondents’ likelihood to vote based on how they answer questions about their current voting intention and past voting behavior. According to this model, Obama’s advantage over McCain is 50% to 46% in Oct. 9-11 tracking data.
The second likely voter estimate is a variation on the traditional model, but is only based on respondents’ current voting intention. This model would take into account increased voter registration this year and possibly higher turnout among groups that are traditionally less likely to vote, such as young adults and racial minorities (Gallup will continue to monitor and report on turnout indicators by subgroup between now and the election). According to this second likely voter model, Obama has a 51% to 45% lead over McCain. “
(Click here to see how the race currently breaks down by demographic subgroup.)

And for the “registered voters” sample, the figures are 50% Obama, 43% McCain. This means that the different weighting method leads to three different forecasts, with margins of victory ranging from a 4 to 7 percent lead in favor of Obama. With sampling errors of roughly 2%, the weighting method will be crucial in predicting heavily contested states such as Virginia.