Random presentation tips

Every time I attend the MPSA / APSA conferences I am surprised by the level of scholarship discussed here. On other hand, the variance in the quality of the presentations themselves is equally surprising. Here are some random tips on both substance and format:

  1. Do not  spend more than 2 slides or 3 minutes with your introductory / motivation / lit review slides. Your audience is specialized and they do not need you to repeat what “they already know”–they want to hear your empirical or theoretical contribution.  With only 15 minutes to deliver, why not cut to the chase? If a slide titled “My argument” or “my hypotheses” comes until minute 6 or so, it’s already too late: you probably lost my attention by making me think on everybody else’s findings.
  2. For empirical papers, it’s better to start asap with your main hypotheses, perhaps discussing the extant literature around your specific research question. You can also mix the explanation of your data with some lit review (Y, X and Z variables matter because AA and BB say so, or X was relevant for sample period M but not for N).
  3. For reasons that escape me, empirical papers avoid talking about summary statistics or data sources. How am I supposed to interpret your point estimates or marginal effects over  a baseline I am not aware of? Again, discussing summary stats is a great way of combining lit review with that great dataset of yours.  Continue reading

Cómo evaluar reformas electorales

Este miércoles 12 de mayo, Javier Márquez y yo presentaremos nuestro artículo “Un modelo Monte Carlo para la Cámara de Diputados en México” (por publicarse en Política y Gobierno, 2010). El seminario será a la 1pm en la Sala de Seminarios del CIDE. El Dr. Raúl González comentará el artículo. La entrada es libre al público. (Algunas notas previas relacionadas con este tema aquí y aquí.)

Natural experiments in history

An interesting post from Nicolas Baumard (with a great quote on large N vs. small n studies):

On the Use of Natural Experiments in Anthropology

Jared Diamond and Harvard Economist James Robinson have just edited a book on Natural experiments in history. This book reviews eight comparative studies drawn from history, archaeology, economics, economic history, geography, and political science. The studies cover a spectrum of approaches, ranging from a non-quantitative narrative style in the early chapters to quantitative statistical analyses in the later chapters. (…) The conclusion of the book struck me, as I had the feeling that it could have been written for students of culture.

Every field of scholarship, not just human history, experiences tension between narrowly focused case studies and broader synthesis or generalization. Practitioners of the case study method tend to decry syntheses as superficial, coarse-grained, and absurdly oversimplified; practitioners of syntheses tend to decry the case studies as merely descriptive, devoid of explanatory power, and unable to illuminate anything except one particular case study. Eventually, scholars in mature fields come to realize that scholarly understanding required both approaches. Without reliable case studies, generalists have nothing to synthesize; without sound syntheses, specialist lack a framework within which to place their case studies. (…) Continue reading

Chicago / MPSA 2010

This weekend I will be attending the Midwest Political Science Association Conference, in Chicago 22-25 April, 2010. You can find the program and some papers here. These are the abstracts of the papers that we will deliver at the conference.

Subsidized democracy? The effect of public funding to political parties in electoral competitiveness

Javier Aparicio and Jacaranda Pérez (IFE)

[Session 22-19 Comparative Electoral Analysis. Saturday, April 24 10:25 am]

Public funding to political parties has been adopted in a large number of democracies over the last several decades. Public funding seeks two major goals: 1) to level the playing field in electoral races, which should make elections more competitive; and 2) to reduce the entry costs for new political parties, which should enhance the representativeness of the electoral system.  However, there is scant evidence on whether or not any of these objectives are actually achieved. Using a panel dataset of national elections in OECD countries over the 1945 to 2008 period, we estimate the effect of public funding on the competitiveness of both parliamentary and presidential elections.  Our results indicate that public funding is associated with narrower margins of victory and a larger effective number of political parties.  On the other hand, public funding may be associated with lower turnout levels.

The Mexican Supreme Court: Judicial Activism in New Constitutional Courts

Jenny Guardado (NYU) and Javier Aparicio

[Session 3-24 Political Institutions in Contemporary Mexico. Saturday, April 24 12:45 pm]

Under what conditions do newly established constitutional courts exercise their judicial review powers? Recent studies of judicial decision-making have ignored the political process leading to the ling of a case, which creates sample selection problems: Are constitutional courts more active because they receive more cases that are “likely to succeed”, or because the political conditions of each case have a role in the court’s final rulings? We address this issue by exploiting the longitudinal variation in a novel dataset of all constitutional cases presented by sub-national actors to the Mexican Supreme Court from 1995 to 2005. We use sample selection and propensity score matching models to estimate the likelihood of a positive ruling from the court, conditional on the factors that led to the filing of a case in the first place. Our results indicate that sub-national political pluralism is associated with a higher likelihood of judicial activity. Specifically, the Court’s rulings are more likely to change the status-quo when political fragmentation or competition is higher. Moreover, we find that this effect varies depending on the likelihood of presenting a case. Finally, we find that the partisanship of the actors involved have a lesser impact.

Programa 3×1 para Migrantes

La migración y la pobreza tienen una relación no lineal: los muy pobres no pueden sortear los costos de migrar y los ricos no quieren migrar.  El panel izquierdo de este box plot ilustra los niveles de intensidad migratoria de los municipios mexicanos para cada grado de marginación (desde muy baja hasta muy alta marginación). El índice de intensidad migratoria corresponde a 2002 y la marginación es de 2005, ambos de CONAPO.

El rectángulo sólido de cada boxplot ilustra el percentil 25, 50 (mediana) y 75 de cada grupo de observaciones. Como se aprecia, la intensidad migratoria mediana es mayor en los municipios de marginación media y es allí donde, además, tiene mayor varianza.  Por otro lado, la menor intensidad migratoria está en los municipios de alta y muy alta marginación.

Continue reading

Reducción de plurinominales

Por Javier Márquez y Javier Aparicio

La iniciativa de reforma política del Presidente Felipe Calderón propone, entre otras cosas, disminuir de 500 a 400 curules la Cámara de Diputados. La propuesta es mantener la proporción de curules uninominales (de 300 a 240) y plurinominales (de 200 a 160).  ¿Qué efectos tiene esta propuesta, más allá del efecto retórico de “tener menos diputados”?

Dejando de lado el impacto de una menor Cámara en los problemas de coordinación parlamentaria, el efecto neto de esta reforma en la correlación de fuerzas del Congreso es difícil de anticipar por tres razones. En primer lugar, la reducción de diputados uninominales de 300 a 240 implica por fuerza una redistritación, la cual puede modificar notablemente el número de curules de mayoría relativa de los principales partidos políticos. Esto se debe a que la distribución territorial de las preferencias políticas no es homogénea para cada partido. De hecho, distritos de mayor tamaño pueden afectar relativamente más a aquellos partidos que tienen una base electoral regionalmente concentrada, como el PRD.

En segundo lugar, la reducción de curules plurinominales (manteniendo constantes los de mayoría relativa) a su vez produciría un mayor “sesgo mayoritario” al interior de la los Cámara. Por ejemplo, si hoy no hubiera plurinominales el PRI tendría 184 de 300 curules (61.3% de la Cámara) en vez de 237 de 500 (47.4%) asientos que hoy tiene por ambos principios.  Por último, si el número de plurinominales es relativamente bajo, los partidos políticos pequeños difícilmente alcanzarían los votos necesarios para conseguir más de unos cuantos escaños.

¿Cuál sería el efecto disminuir el número de curules plurinominales, manteniendo otros factores constantes? La siguiente gráfica ilustra el tamaño relativo de las bancadas como una función del número de curules plurinominales en un rango de 50 a 300.  Las simulaciones utilizan los resultados electorales de 2006 y asumen que los resultados de los 300 distritos de mayoría relativa permanecen sin cambio.  Es decir, estamos simulando una Cámara que va desde 350 a 600 curules–una Cámara mixta cada vez “más proporcional”.

Porcentaje de curules en la Cámara en función del número de curules plurinominales, manteniendo constantes los resultados de 2006. (Fuente: Márquez y Aparicio, 2010)

Como puede apreciarse, el porcentaje de curules totales no varía más de 2 puntos porcentuales con respecto al porcentaje realmente observado en 2006 (líneas punteadas). Conforme la Cámara se hace “más proporcional”, la bancada del PAN y la Coalición Por el Bien de Todos (PBT) –los punteros en 2006– disminuye en términos relativos. Por otro lado, las bancadas del PRI+PVEM (APM), Nueva Alianza y ASDC, aumentan relativamente conforme se crece el número de plurinominales–tal y como es de esperarse de una Cámara “menos mayoritaria”.  Nótese, además, que el tamaño de las bancadas de NA y ASDC tienen cambios “más bruscos”, debido a su reducido número de votos.

En resumen, reducir el número de plurinominales de 200 a 160 tiene efectos muy modestos en las bancadas de los principales partidos (menores a 2%), pero que pueden ser sustanciales para los partidos pequeños. Sin embargo, reducir el número de curules de mayoría relativa puede tener un impacto significativo en la composición de la Cámara, pues la redistritación alteraría el sesgo mayoritario y, sobre todo, el sesgo partidista de la distritación actual.  Por último la economía política de disminuir el tamaño de la Cámara tampoco es nada sencilla: considérese tan sólo el problema de determinar quiénes serían los 60 municipios que dejarían de ser cabezas de distrito.

Para más detalles sobre estos resultados, véase:

Vote buying, pork barrel & district geography in the US

If you think vote buying/pork-barrel politics can only be studied in developing countries or young democracies, think again. This is precisely the research agenda of Jowei Chen, a young professor at the University of Michigan.  I met him in APSA 2009 and, as you can see, it is really great stuff (the following links are from his own website):

1. Vote Buying in United States Elections:

FEMA hurricane disaster aid increases Bush votes among core Republicans, but not among Democrats or nonpartisans. FEMA also awards disproportionately more aid to Republican applicants, even conditioning on hurricane severity. Full Abstract.
Government monetary awards converted poor voters into Bush supporters in November 2004. Full Abstract

2. The Geographic Targeting of Pork Barrel Projects:

American Political Science Review. Vol. 101, No. 4: p. 657-676. Abstract
Forthcoming, American Journal of Political Science. Vol. 54, No. 2. Abstract

3. The Electoral Geography of Legislative Districting:

We conduct legislative districting simulations using only the apolitical criteria of drawing compact and contiguous districts. We show that the Republican party naturally wins a disproportionately large share of legislative seats in Florida, even without gerrymandering. This result emerges because Democratic voters tend to live in highly concentrated, urban cores, thus “wasting” their electoral strength on a small number of landslide Democratic districts. Republican voters are geographically dispersed more evenly throughout the hinterlands, allowing the Republican party to win a disproportionate share of districts by a slight margin.

Social science humor

Via Monkey Cage, a selection of humorous quotes on Social Science, “all collected or concocted by the irrepressible A. Wuffle. If you like this sort of thing, then stay tuned for the soon-to-be-released Wit and Humor of Political Science (Sigelman, Newton, Meier, and Grofman, eds., which is slated for publication in January)”:

Thou shalt not commit a Social Science. — W. H. Auden

God gave all the easy problems to the physicists. – James March

In the social sciences, waiting for Newton is like waiting for Godot. — Lee Cronbach and Philip Converse

To avoid the problem of scientific validity, three strategies are commonly followed in the social sciences: (a) eschewing falsifiable statements; (b) denying the possibility of objective truth, and (c) writing in French or German. The combination of these three strategies has been shown to be virtually irresistible, even to strong minds. Statements which on the face of it are unintelligible gibberish can always be blamed on a bad translation. — A Wuffle

An economist is one who observes something that works in practice and wonders if it will work in theory. — As told to Bernard Nelson by Victor Fuchs

If you put all the economists in the country end to end, they’d still point in different directions. — Harry S. Truman

The Economist’s Motto: To err is human, to be paid for it divine. — Victor Fuchs

Those who do not know the past are condemned to repeat History 101. — Anon.

I dropped out of American Studies after the first exam, when I found out that the correct answer to all four questions was “hegemony.” — Emily Polsby

If you can understand an article in the APSR then something must have gone wrong in the refereeing process. – A Wuffle

Sociology is the branch of science with the most methods and the least results. – Henri Poincare, circa 1909-10

Seasons matter

The Wall Street Journal reports on an important paper:

Children born in the winter months already have a few strikes against them. Study after study has shown that they test poorly, don’t get as far in school, earn less, are less healthy, and don’t live as long as children born at other times of year. Researchers have spent years documenting the effect and trying to understand it. But economists Kasey Buckles and Daniel Hungerman at the University of Notre Dame may have uncovered an overlooked explanation for why season of birth matters.

This is the paper and abstract:

Season of Birth and Later Outcomes: Old Questions, New Answers
Kasey Buckles and Daniel M. Hungerman (University of Notre Dame).
NBER Working Paper No. 14573 / December 2008

Research has found that season of birth is associated with later health and professional outcomes; what drives this association remains unclear. In this paper we consider a new explanation: that children born at different times in the year are conceived by women with different socioeconomic characteristics. We document large seasonal changes in the characteristics of women giving birth throughout the year in the United States. Children born in the winter are disproportionally born to women who are more likely to be teenagers and less likely to be married or have a high school degree.

We show that controls for family background characteristics can explain up to half of the relationship between season of birth and adult outcomes. We then discuss the implications of this result for using season of birth as an instrumental variable; our findings suggest that, though popular, season-of-birth instruments may produce inconsistent estimates. Finally, we find that some of the seasonality in maternal characteristics is due to summer weather differentially affecting fertility patterns across socioeconomic groups.

And this is what the evidence looks like:

SeasonalBirths

Our built-in expiration date

From the Gravity and Levity blog, a nice lesson in statistics, fitting data to density functions, and the probability of living and dying:

Your body wasn’t built to last: a lesson from human mortality rates

What do you think are the odds that you will die during the next year?  Try to put a number to it — 1 in 100?  1 in 10,000?  Whatever it is, it will be twice as large 8 years from now.

This startling fact was first noticed by the British actuary Benjamin Gompertz in 1825 and is now called the “Gompertz Law of human mortality.”  Your probability of dying during a given year doubles every 8 years.  For me, a 25-year-old American, the probability of dying during the next year is 0.03% — about 1 in 3,000.  When I’m 42 it will be about 1 in 750, and so on.  By the time I reach age 100 the probability of living to 101 will only be about 0.5%.  This is seriously fast growth — my mortality rate is increasing exponentially with age.

And if my mortality rate (the probability of dying during the next year) is rising exponentially, that means that the probability of me surviving to a particular age is falling super-exponentially.

Read the whole thing here (including nice graphs!). And here is a beautiful death probability calculator :-).

Statistics are sexy!

This is from The New York Times (August 6, 2009):

For Today’s Graduate, Just One Word: Statistics

MOUNTAIN VIEW, Calif. — At Harvard, Carrie Grimes majored in anthropology and archaeology and ventured to places like Honduras, where she studied Mayan settlement patterns by mapping where artifacts were found. But she was drawn to what she calls “all the computer and math stuff” that was part of the job.

“People think of field archaeology as Indiana Jones, but much of what you really do is data analysis,” she said. Now Ms. Grimes does a different kind of digging. She works at Google, where she uses statistical analysis of mounds of data to come up with ways to improve its search engine. Ms. Grimes is an Internet-age statistician, one of many who are changing the image of the profession as a place for dronish number nerds. They are finding themselves increasingly in demand — and even cool.

I keep saying that the sexy job in the next 10 years will be statisticians,” said Hal Varian, chief economist at Google. “And I’m not kidding.”

The rising stature of statisticians, who can earn $125,000 at top companies in their first year after getting a doctorate, is a byproduct of the recent explosion of digital data. In field after field, computing and the Web are creating new realms of data to explore — sensor signals, surveillance tapes, social network chatter, public records and more. And the digital data surge only promises to accelerate, rising fivefold by 2012, according to a projection by IDC, a research firm.”

Also related, a blog confession by Peter R. Orszag, director of the Office of Management and Budget:

The President has made it very clear that policy decisions should be driven by evidence – accentuating the role of Federal statistics as a resource for policymakers.  Robust, unbiased data are the first step toward addressing our long-term economic needs and key policy priorities.

In my speech this morning, I noted two particular areas where more and better data would be useful: health care and education.  In health care, bending the curve on cost growth will require more information about how we’re spending our health dollars, the health outcomes we’re producing, and how specific interventions rank against alternative treatments.  In education, better longitudinal data on the progress of individual students, which can be linked to specific programs and teachers, will go a long way to helping us understand what works better – and what doesn’t — and as a result, where to target scarce resources to bolster student achievement.

Taleb on the Limits of Statistics

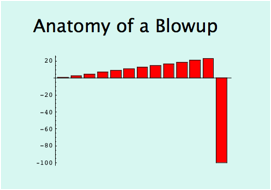
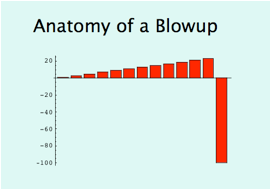
Taleb’s classical metaphor: “A turkey is fed for a 1000 days—every days confirms to its statistical department that the human race cares about its welfare ‘with increased statistical significance’. On the 1001st day, the turkey has a surprise.”

Some quotable quotes from Taleb’s essay:

“Statistical and applied probabilistic knowledge is the core of knowledge; statistics is what tells you if something is true, false, or merely anecdotal; it is the “logic of science”; it is the instrument of risk-taking; it is the applied tools of epistemology; you can’t be a modern intellectual and not think probabilistically—but… let’s not be suckers. The problem is much more complicated than it seems to the casual, mechanistic user who picked it up in graduate school. Statistics can fool you. In fact it is fooling your government right now.

“By the “narrative fallacy” the turkey economics department will always manage to state, before thanksgivings that “we are in a new era of safety”, and back-it up with thorough and “rigorous” analysis. And Professor Bernanke indeed found plenty of economic explanations—what I call the narrative fallacy—with graphs, jargon, curves, the kind of facade-of-knowledge that you find in economics textbooks. This is the find of glib, snake-oil facade of knowledge—even more dangerous because of the mathematics. (…) I have nothing against economists: you should let them entertain each others with their theories and elegant mathematics, and help keep college students inside buildings. But beware: they can be plain wrong, yet frame things in a way to make you feel stupid arguing with them.

What Is Wise To Do (Or Not Do) In The Fourth Quadrant

(NB: The 4th quadrant basically refers to heavy-tailed or unknown probability distributions with complex or nonlinear payoffs)

1) Avoid Optimization, Learn to Love Redundancy. Psychologists tell us that getting rich does not bring happiness—if you spend it. But if you hide it under the mattress, you are less vulnerable to a black swan. (…) Biological systems—those that survived millions of years—include huge redundancies. (…) Historically populations tended to produced around 4-12 children to get to the historical average of ~2 survivors to adulthood.

2) Avoid prediction of remote payoffs—though not necessarily ordinary ones. Payoffs from remote parts of the distribution are more difficult to predict than closer parts. A general principle is that, while in the first three quadrants you can use the best model you can find, this is dangerous in the fourth quadrant: no model should be better than just any model.

3) Beware the “atypicality” of remote events. There is a sucker’s method called “scenario analysis” and “stress testing”—usually based on the past (or some “make sense” theory).

4) Time. It takes much, much longer for a times series in the Fourth Quadrant to reveal its property. At the worst, we don’t know how long. Things that have worked for a long time are preferable—they are more likely to have reached their ergodic states.

5) Beware Moral Hazard. Is optimal to make series of bonuses betting on hidden risks in the Fourth Quadrant, then blow up and write a thank you letter.

6) Metrics. Conventional metrics based on type 1 randomness don’t work. Words like “standard deviation” are not stable and does not measure anything in the Fourth Quadrant. 70-90% of the Kurtosis in Oil, SP500, Silver, UK interest rates, Nikkei, US deposit rates, sugar, and the dollar/yet currency rate come from 1 day in the past 40 years.

Bayesian articles in JSTOR

De pura curiosidad hice unas busquedas en JSTOR sobre artículos con el keyword “bayesian” en el titulo o bien en el abstract, publicados entre 1980 y hoy dia, en diferentes grupos de journals. Estos son los resultados:
 
JSTOR search:  for « (ab:(bayesian) OR ti:(bayesian)) AND ty:FLA AND (year:[1980 TO 3000]) in multiple journals »
 
Journal group                            Number of hits
Statistics (23 journals)                           1641
Economics (52 journals)                             333
Philosophy (26 journals)                            109
Political Science (43 journals)                      30
Sociology (46 journals)                              23
Public Policy & Administration (11 journals)          1
 
La lista habla por si sola.  No cabe duda que la onda bayesiana ha conquistado amplio terreno entre los estadísticos y que no le va tan mal en economía.  Los hits en filosofia son toda una sopresa pero consideren que esta lista incluye journals de filosofia de la ciencia.  
 
En Ciencia Política y Sociología apenas está haciendo su caminito–lo cual en parte explica el fervor con que predican su evangelio los bayesianos (please, please, this is THE WAY!!  stop doing OLS and MLE!!).  En cuanto a PP&A mejor me ahorro el comentario.
 
Otra interpretación es que aún le faltan sus añitos para que esto cuaje en el mainstream de CP–por ejemplo, cuando aparezca software amigable, tipo stata, que haga estas cosas.  Otra interpretación es que hay grandes rendimientos por treparse al vagón justo ahora…   Food for thought…

New books for a new year

I spent the holidays in the U.S. so I had time to update my bookshelves with some volumes I wanted to get for a while…
 
POLITICAL ECONOMY
 
 
I will be using the Oxford Handbook as one of the main sources for my political economy class this spring term–taking the place of Mueller’s previous compilation: its several chapters provide an up to date survey on what has become a quite large literature.  Besley and Acemoglu/Robinson will only be suggested readings–these two volumes comprise something like the most current theoretical framework for political/institutional economics.
 
ECONOMETRICS
 
Microeconometrics: Methods and Applications By: A. Colin Cameron, Pravin K. Trivedi
 
Quoting from the authors’ website:
“Distinguishing features include emphasis on nonlinear models and robust inference, as well as chapter-length treatments of GMM estimation, nonparametric regression, simulation-based estimation, bootstrap methods, Bayesian methods, stratified and clustered samples, treatment evaluation, measurement error, and missing data.”
 
This volume has very nice supplement materials available on the web:
 
GENERAL INTEREST
 
Stumbling on Happiness By: Daniel Gilbert
 
ECONOMIC THOUGHT


Statistical Quote of the day

This is Tyler Cowen offering personal advice (the emphasis is mine):
 
“…If she splits with him, she will be “drawing from the urn without replacement,” as they say.  And what a very special urn it is.  Should she think that simply making another choice will yield something much better?  At least this first pick a) plays at least two musical instruments, and b) is taking medication, which is more than you can say for the median impotent, nervous, obsessive-compulsive, alcoholic musician.